The dataset includes two parts that are: 1) channel flow, crop pattern, field management, and socio-economy data measured at super-station in 2008, 2010, 2011, 2012 (UTC+8), respectively. 2) irrigation data, crop pattern, and socio-economy data investigated at Daman irrigation district and Yingke irrigation district, respectively. 1.1 Objective of investigation Objectives of investigation for two parts data are to obtain crop pattern and irrigation water volume change with time, and to supply parameter for irrigation water optimal allocation model. 1.2 Investigation spots and items Investigation spots include six water management stations that are Dangzhai, Hua’er, Daman, Xiaoman, Jiantan, and Ershilidun, respectively, at Daman irrigation district. Investigation items comprise water allocation time, branch channel inflow, Dou channel inflow, irrigation area, channel water use efficiency, water price, and water fee. Investigation time is described as followed: 2012.03.16 to 2012.04.04, Spring irrigation; 2012.04.04 to 2012.05.14, Summer irrigation; 2012.05.20 to 2012.06.24, Summer irrigation; 2012.05.16 to 2012.07.06, Summer irrigation; 2012.07.15 to 2012.08.02, Autumn irrigation; 2012.08.10 to 2012.08.26, Autumn irrigation. Investigation spots include eight water management station that are Chang’an, Shangqin, Dangzhai, Liangjiadun, Shimiao, Xiaoman, Xindun, and Yangou, respectively, at Yingke irrigation district. Investigation time and items is described as followed: Year Data items Spots 2008, 2010, 2011 Irrigation data: Irrigation time, water level of Dou channel, channel flow, irrigation area Xiaoman county, Shangtouzha village 2012 Irrigation data: Irrigation time, water level of Dou channel, channel flow, irrigation area Chang’an, Shangqin, Dangzhai, Liangjiadun, Shimiao, Xiaoman, Xindun, Yangou 2012 Well data: Well deep, groundwater abstraction, irrigation area Chang’an, Liangjiadun, Shangqin 2012 Socio-economy data: population, agricultural income, un-agricultural income, water use for living, average residential area, education Chang’an, Xiaoman, Liangjiadun, Shangqin 2012 Field management: fertilizer name, fertilization time, fertilization rate, pesticide name, pesticide rate, time Chang’an, Xiaoman, Liangjiadun, Shangqin 2008, 2010, 2011, 2012 Crop pattern: crop name, seed time, harvest time, crop area, irrigation quota, field water use efficiency, crop yield, crop production value Xiaoman, Chang’an, Liangjiadun, Shangqin 1.3 Data collection Data was collected by cooperating with water management department of Yingke and Daman.
GE Yingchun, Xu Fengying, LI Xin
")
The annual total net primary productivity (NPP) and average productivity of different ecosystems in heihe river basin from 1998 to 2002 were estimated by using the light energy utilization model c-fix, high spatial and temporal resolution remote sensing data of SPOT/VEGETATION, global grid meteorological reanalysis data and land use map of heihe river basin. From 1998 to 2002, the 10-day 1-km resolution SPOT VEGETATATION NDVI (10-day maximum synthesis) data product in the heihe basin, provided by the image processing and archiving center (CTIV) of VITO institute, Belgium, was used to calculate the key parameters fAPAR required by the c-fix model. The daily temperature and total radiation of heihe river basin from 1998 to 2002 were obtained using a global 1.5 °× 1.5 ° grid meteorological data product from MeteoFrance. It contains the spatial distribution pattern of annual accumulation of NPP in heihe basin and the seasonal dynamic map of NPP.The spatial resolution of this data is 1km.
LU Ling
")
Data analysis method: macroeconomic development forecast Space scope: Sunan County, Ganzhou District, Minle County, Linze County, Gaotai County, Shandan County, Jinta County, Ejina, Suzhou District, Jiayuguan Time frame: 2020, 2030 Data: GDP (1 million yuan), GDP growth rate, primary production (1 million yuan), primary production growth rate, secondary production (million yuan), secondary production growth rate, tertiary production (million yuan), tertiary production growth rate, primary production rate Second rate, third rate
WANG Zhongjing
")
1. Data overview Take Ganzhou District, Linze County and Gaotai County of Zhangye City in the middle reaches of Heihe River Basin as the research area, and carry out input-output survey on agricultural, industrial and service enterprises and individuals in the research area from May to November 2013. According to the survey data, use the survey method to compile the input-output table of 42 departments in 2012 in this area. 2. The data content Data mainly reflects the input-output of various national economic industries in the process of production, circulation and consumption in ganlingao region in 2012.
XU Zhongmin, SONG Xiaoyu
")
This data set contains information on natural disasters in Qinghai over nearly 50 years, including the times, places and the consequences of natural disasters such as droughts, floods, hail, continuous rain, snow disasters, cold waves and strong temperature drops, low temperature freezing injuries, gales and sandstorms, pest plagues, rats, and geological disasters. Qinghai Province is located in the northeastern part of the Tibetan Plateau and has a total area of 720,000 square kilometers. Numerous rivers, glaciers and lakes lie in the province. Because two mother rivers of the Chinese nation, the Yangtze River and the Yellow River, and the famous international river—the Lancang River—originated here, it is known as the "Chinese Water Tower"; there are 335,000 square meters of available grasslands in the province, and the natural pasture area ranks fourth in the country after those of Inner Mongolia, Tibet and Xinjiang. There are various types of grasslands, abundant grassland resources, and 113 families, 564 genera and 2100 species of vascular plants, which grow and develop under the unique climatic condition of the Tibetan Plateau and strongly represent the characteristics of the plateau ecological environment. As the main part of the Tibetan Plateau, Qinghai Province is one of the centers of the formation and evolution of biological species in China. It is also a sensitive area and fragile zone for the study of climate and ecological environment in the international field of sciences and technology. The terrain and land-forms in Qinghai are complex, with interlaced mountains, valleys and basins, widely distributed snow and glaciers, the Gobi and other deserts and grassland. Complex terrain conditions, high altitudes and harsh climatic conditions make Qinghai a province with frequent meteorological disasters. The main meteorological disasters include droughts, floods, hail, continuous rain, snow disasters, cold waves and strong temperature drops, low temperature freezing injuries, gales and sandstorms. The data are extracted from the Qinghai Volume of Chinese Meteorological Disaster Dictionary, with manual entry, summarizing and proofreading.
Qinghai Provincial Bureau of Statistics
")
Some economic data of Zhangye City from 2001 to 2012 include: per capita GDP, GDP, the proportion of fiscal revenue to GDP, per capita fiscal revenue, industrial contribution rate, the proportion of town population to total population, the proportion of added value of tertiary industry to GDP, the proportion of added value of secondary industry to GDP, industrial comprehensive benefit index, contribution rate of total assets, contribution rate of fixed assets, social labor productivity, G DP growth rate
ZHANG Dawei
")
This data set contains statistical tables on the community situation of each county in Three-River-Source National Park. The specific contents include: Table 1 includes: number of administrative villages, number of natural villages, number of households, population, number of rural labor force, total value of primary and secondary industries, net income per capita, and number of livestock. Table 2 includes: the ethnic composition of the population (population of each ethnic group), education-related statistics (number of primary and secondary schools and number of students), health-related statistics (number of hospitals, health rooms and medical personnel), and statistics on the education level of the population (number of people with different education levels); Table 3 includes: the grassland (total grassland area, usable grassland area, moderately degraded area and grassland vegetation coverage), woodland (total area, arbor forest area, shrub forest area and sparse forest area), water area (total area, river area, lake area, glacier area, snowy mountain area and wetland area). A total of four counties were designed: Maduo, Qumalai, Zaduo and Zhiduo. This data comes from statistics of government departments.
National Bureau of Statistics
")
Input output table of 11 districts and counties in Heihe River Basin in 2012
DENG XiangZheng

1. Data overview Based on the collected statistical yearbooks and survey data of counties and districts in Zhangye City in the middle reaches of Heihe River, the social and economic database in the middle reaches is constructed to reflect the basic situation of regional social economy. 2. Data content The database includes two data sets: (1) statistical yearbook data; (2) survey data of human factors in river basin. The statistical yearbook data mainly includes a number of relevant statistical data such as the gross product, financial revenue, construction of villages and towns, industrial output value, grain output, etc. of Zhangye City and its towns. The survey data of human factors in Heihe River Basin mainly include the survey data of social capital, cultural theory, happiness index and sustainable consumption in Heihe River Basin. 3. Time and space The statistical yearbook data is the statistical data of Ganzhou District, Linze County, Gaotai County, Sunan County, Shandan County, Minle county and towns under the jurisdiction of each county from 1990 to 2010. The survey data of human factors in the basin is the corresponding survey data of counties in the upper, middle and lower reaches in 2005.
XU Zhongmin
")
The social accounting matrix, also known as the national economy comprehensive matrix or the national economy circulation matrix, uses the matrix method to connect the various accounts of the national economy systematically, represents the statistical index system of the national economy accounting system, and reflects the circulation process of the national economy operation. It uses the matrix form to arrange the national accounts orderly according to the flow and stock, domestic and foreign. The data reflects the balanced value of social accounting matrix in Gaotai County.
DENG XiangZheng

This data includes animal products and labor prices; economic income structure, level and per capita net income; economic expenditure structure, productive and living expenditure structure; population composition, labor and household head age and education level; pasture area, grade, suitable stocking capacity; , livestock sheds, human and animal drinking water, pastoral roads, fence construction scale; maintenance scale, and livestock structure.
ZHAO Chengzhang
"Hydrological ecological economic process coupling and evolution of Heihe River basin governance under the framework of water rights" (91125018) project data collection - economic and social data of Heihe River 2010 . 1. Data overview: Economic and social data of Heihe River 2010. 2. Data content: Economic and social data of Ganzhou District, Linze County and Gaotai County of Heihe River Basin 2010.
WANG Zhongjing
")
1. Data overview: water footprint and virtual water trade of tertiary industry in gansu province in 1997, 2002 and 2007 2. Data content: input-output value flow statement of gansu province, input-output value flow statement of primary industry, secondary industry and tertiary industry of gansu province, water use data, water footprint and virtual water trade data 3. Spatial and temporal scope: data time is 1997, 2002 and 2007;The space scope is gansu province 4. Data description: The data in this part are mainly the socio-economic and regional water supply and consumption data of gansu province, including the following 5 documents: (1) table of input and output of gansu province. XLS: value flow table of input and output of gansu province in 1997, 2002 and 2007, raw data of social economy. (2) input and output table of gansu province. XLS: input and output table of primary industry, secondary industry and tertiary industry of gansu province in 1997, 2002 and 2007 (3) summary table of water use data. XLS: original water use data. (4) calculation results of gansu province. (5) description of virtual water trade data of gansu province. For detailed data description, please refer to "gansu province virtual water trade data description" word document.
LIU Junguo
")
The data set contains agricultural economic data of all counties and regions in the Tibetan Plateau in 1980-2015, and covering the total number of households and total population in rural areas, agricultural population, rural labor force, cultivated land, paddy field area, the dry land area, power of agricultural machinery, agricultural vehicles, mechanical ploughing area, irrigation area, consumption of chemical fertilizers electricity use, gross output value of agriculture, forestry, animal husbandry and fishery, the output of cattle, pig, sheep, meat, poultry, and fish, the sown area of grain, the output of grain, cotton, oil and all kinds of crops, and characteristic agricultural products and livestock production and other relevant data.The data came from the statistical yearbook of the provinces included in the Tibetan Plateau.The data are of good quality and can be used to analyze the socio-economic and agricultural development of qinghai-tibet plateau.
LV Changhe
Input output table of 11 districts and counties in Heihe River Basin in 2012
DENG XiangZheng
It includes the social and economic data of Gansu, Qinghai and Inner Mongolia from 2000 to 2012. The specific indicators include GDP, income, population, employment, medical care, education, land area, finance and a series of social and economic indicators;
DENG XiangZheng
")
This data set is collected according to the output results of tesim ecological process model, including biomass, plant N and P content, evapotranspiration, NPP and other model output results. Some of the results are obtained by field measurement, some by laboratory analysis of field samples, some by literature.
PENG Hongchun
")
The data set is the global vegetation productivity data, including Gross Primary Productivity(GPP) and Net Primary Productivity (NPP). It was obtained by the CNRM-CM6-1 mode simulation of CMIP6 under the Historical scenario. The time range of the data covers from 1850 to 2014, the time resolution is a month, and the spatial resolution is about 1.406°×1.389°. For the simulated data details, please go to the following link: http://www.umr-cnrm.fr/cmip6/spip.php?article11.
Program for Climate Model Diagnosis and Intercomparison (PCMDI)

The degree of opening to the outside world refers to the degree of opening to the outside world of a country or region's economy, which is embodied in the degree of opening to the outside world of the market, usually including the amount of import and export, the use of foreign capital, the level of tariff, the convenience of customs clearance, free trade agreements, market access, capital exchange, intellectual property protection, etc. The data are one belt, one road, 64 countries, including the net inflow of foreign direct investment (US $100 million), total import (US $100 million) and total export volume (US $100 million). Data sources include the world bank, the United Nations Conference on Trade and development, and the WTO. The 64 countries along the line include 16 in West Asia and North Africa, 16 in central and Eastern Europe, 5 other CIS countries, 8 in South Asia, 11 in Southeast Asia, including Myanmar, Vietnam and Thailand, and 5 in Mongolia, Russia and Central Asia.
SONG Tao
")
This data set contains the results of the calculation of Net Primary Productivity (NPP) on the Tibetan Plateau based on ecological models and remote sensing data from 1982 to 2006. Ecosystem NPP of the Tibetan Plateau was generated based on the remote sensing Advanced Very High Resolution Radiometer (AVHRR) data and the Carnegie-Ames-Stanford Approach (CASA) model(1982-2006), the soil carbon content was generated based on the second soil census data, and the biomass carbon data were generated based on the High Resolution Biosphere Model (HRBM) model. Forest ecosystem NPP of the Tibetan Plateau (1982-2006): npp_forest82.e00,npp_forest83.e00,npp_forest84.e00,npp_forest85.e00,npp_forest86.e00, npp_forest87.e00,npp_forest88.e00,npp_forest89.e00,npp_forest90.e00,npp_forest91.e00, npp_forest92.e00,npp_forest93.e00,npp_forest94.e00,npp_forest95.e00,npp_forest96.e00, npp_forest97.e00,npp_forest98.e00,npp_forest99.e00,npp_forest00.e00,npp_forest01.e00, npp_forest02.e00,npp_forest03.e00,npp_forest04.e00,npp_forest05.e00,npp_forest06.e00 Grassland ecosystem NPP of the Tibetan Plateau(1982-2006): npp_grass82.e00,npp_grass83.e00,npp_grass84.e00,npp_grass85.e00,npp_grass86.e00, npp_grass87.e00,npp_grass88.e00,npp_grass89.e00,npp_grass90.e00,npp_grass91.e00, npp_grass92.e00,npp_grass93.e00,npp_grass94.e00,npp_grass95.e00,npp_grass96.e00, npp_grass97.e00,npp_grass98.e00,npp_grass99.e00,npp_grass00.e00,npp_grass01.e00,npp_grass02.e00,npp_grass03.e00,npp_grass04.e00,npp_grass05.e00,npp_grass06.e00. Biomass carbon and soil carbon of the Tibetan Plateau: Biomass.e00,Socd.e00. The soil carbon content data (Socd) are generated based on data of the second soil census of China and Soil Map of China (1:1,000,000) by soil subclass interpolation. The NPP data are generated from the CASA model and AVHRR data simulation: Potter CS, Randerson JT, Field CB et al. Terrestrial ecosystem production: a process model based on global satellite and surface data. Global Biogeochemical Cycles, 1993, 7: 811–841. The biomass carbon data are generated via HRBM model simulation: McGuire AD, Sitch S, et al. Carbon balance of the terrestrial biosphere in the twentieth century: Analyses of CO2, climate and land use effects with four process-based ecosystem models. Global Biogeochem. Cycles, 2001, 15 (1), 183-206. The raw data are mainly remote sensing data and field observation data with high accuracy; the verification and adjustment of the measured data in the field during the production were undertaken to maintain the error of the simulation results and the field measured data within the acceptable range as much as possible; the verification results of the NPP data and the field measured data show that the error remains within 15%. The spatial resolution is 0.05°×0.05° (longitude×latitude).
ZHOU Caiping
")
This data set contains sequence data of the number variation of livestock in the major cities and counties of the Tibetan Plateau from 1970 to 2006. It is used to study the social and economic changes of the Tibetan Plateau. The table has ten fields. Field 1: Year Interpretation: Year of the data Field 2: Province Interpretation: The province from which the data were obtained Field 3: City/Prefecture Interpretation: The city or prefecture from which the data were obtained Field 4: County Interpretation: The name of the county Field 5: Large livestock (10,000) Interpretation: The number of large livestock such as cattle, horses, mules, donkeys, and camels. Field 6: Cattle herd (10,000) Interpretation: Number of cattle Field 7: Equine animals(10,000) Interpretation: The number of equine animals such as horses, mules and donkeys. Field 8: Horses (10,000) Interpretation: The number of horses Field 9: Sheep (10,000) Interpretation: The number of sheep Field 10: Data Sources Interpretation: Source of Data The data come from the statistical yearbook and county annals. Some are listed as follows. [1] Gansu Yearbook Editorial Committee. Gansu Yearbook [J]. Beijing: China Statistics Press, 1984, 1988-2009 [2] Statistical Bureau of Yunnan Province. Yunnan Statistical Yearbook [J]. Beijing: China Statistics Press, 1988-2009 [3] Statistical Bureau of Sichuan Province, Sichuan Survey Team. Sichuan Statistical Yearbook [J]. Beijing: China Statistics Press, 1987-1991, 1996-2009 [4] Statistical Bureau of Xinjiang Uighur Autonomous Region . Xinjiang Statistical Yearbook [J]. Beijing: China Statistics Press, 1989-1996, 1998-2009 [5] Statistical Bureau of Tibetan Autonomous Region. Tibet Statistical Yearbook [J]. Beijing: China Statistics Press, 1986-2009 [6] Statistical Bureau of Qinghai Province. Qinghai Statistical Yearbook [J]. Beijing: China Statistics Press, 1986-1994, 1996-2008. [7] County Annals Editorial Committee of Huzhu Tu Autonomous County. County Annals of Huzhu Tu Autonomous County [J]. Qinghai: Qinghai People's Publishing House, 1993 [8] Haiyan County Annals Editorial Committee. Haiyan County Annals[J]. Gansu: Gansu Cultural Publishing House, 1994 [9] Menyuan County Annals Editorial Committee. Menyuan County Annals[J]. Gansu: Gansu People's Publishing House, 1993 [10] Guinan County Annals Editorial Committee. Guinan County Annals [J]. Shanxi: Shanxi People's Publishing House, 1996 [11] Guide County Annals Editorial Committee. Guide County Annals[J]. Shanxi: Shanxi People's Publishing House, 1995 [12] Jianzha County Annals Editorial Committee. Jianzha County Annals [J]. Gansu: Gansu People's Publishing House, 2003 [13] Dari County Annals Editorial Committee. Dari County Annals [J]. Shanxi: Shanxi People's Publishing House, 1993 [14] Golmud City Annals Editorial Committee. Golmud City Annals [J]. Beijing: Fangzhi Publishing House, 2005 [15] Delingha City Annals Editorial Committee. Delingha City Annals [J]. Beijing: Fangzhi Publishing House, 2004 [16] Tianjun County Annals Editorial Committee. Tianjun County Annals [J]. Gansu: Gansu Cultural Publishing House, 1995 [17] Naidong County Annals Editorial Committee. Naidong County Annals [J]. Beijing: China Tibetology Press, 2006 [18] Gulang County Annals Editorial Committee. Gulang County Annals [J]. Gansu: Gansu People's Publishing House, 1996 [19] County Annals Editorial Committee of Akesai Kazak Autonomous County. County Annals of Akesai Kazakh Autonomous County [J]. Gansu: Gansu People's Publishing House, 1993 [20] Minxian County Annals Editorial Committee. Minxian County Annals [J]. Gansu: Gansu People's Publishing House, 1995 [21] Dangchang County Annals Editorial Committee. Dangchang County Annals [J]. Gansu: Gansu Cultural Publishing House, 1995 [22] Dangchang County Annals Editorial Committee. Dangchang County Annals(Sequel) (1985-2005) [J]. Gansu: Gansu Cultural Publishing House, 2006 [23] Wenxian County Annals Editorial Committee. Wenxian County Annals[J]. Gansu: Gansu Cultural Publishing House, 1997 [24] Kangle County Annals Editorial Committee. Kangle County Annals [J]. Shanghai: Sanlian Bookstore. 1995 [25] County Annals Editorial Committee of Jishishan (Baoan, Dongxiang, Sala) Autonomous County. County Annals of Jishishan (Baoan, Dongxiang, Sala) Autonomous County[J], Gansu: Gansu Cultural Publishing House, 1998 [26] Luqu County Annals Editorial Committee. Luqu County Annals [J]. Gansu: Gansu People's Publishing House, 2006 [27] Zhouqu County Annals Editorial Committee. Zhouqu County Annals [J]. Shanghai: Sanlian Bookstore. 1996 [28] Xiahe County Annals Editorial Committee. Xiahe County Annals [J]. Gansu: Gansu Cultural Publishing House, 1999 [29] Zhuoni County Annals Editorial Committee. Zhuoni County Annals [J]. Gansu: Gansu Nationality Publishing House, 1994 [30] Diebu County Annals Editorial Committee. Diebu County Annals [J]. Gansu: Lanzhou University Press, 1998 [31] Pengxian County Annals Editorial Committee. Pengxian County Annals [J]. Sichuan: Sichuan People's Publishing House, 1989 [32] Guanxian County Annals Editorial Committee. Guanxian County Annals [J]. Sichuan: Sichuan People's Publishing House, 1991 [33] Wenjiang County Annals Editorial Committee. Wenjiang County Annals [J]. Sichuan: Sichuan People's Publishing House, 1990 [34] Shifang County Annals Editorial Committee. Shifang County Annals [J]. Sichuan: Sichuan University Press, 1988 [35] Tianquan County Annals Editorial Committee. Tianquan County Annals [J]. Sichuan: Sichuan Science and Technology Press, 1997 [36] Shimian County Annals Editorial Committee. Shimian County Annals [J]. Sichuan: Sichuan Cishu Publishing House, 1999 [37] Lushan County Annals Editorial Committee. Lushan County Annals [J]. Sichuan: Fangzhi Publishing House, 2000 [38] Hongyuan County Annals Editorial Committee. Hongyuan County Annals [J]. Sichuan: Sichuan People's Publishing House, 1996 [39] Wenchuan County Annals Editorial Committee. Wenchuan County Annals [J]. Sichuan: Bayu Shushe, 2007 [40] Derong County Annals Editorial Committee. Derong County Annals [J]. Sichuan: Sichuan University, 2000 [41] Baiyu County Annals Editorial Committee. Baiyu County Annals [J]. Sichuan: Sichuan University Press, 1996 [42] Batang County Annals Editorial Committee. Batang County Annals [J]. Sichuan: Sichuan Nationality Publishing House, 1993 [43] Jiulong County Annals Editorial Committee. Jiulong County Annals(Sequel) (1986-2000) [J]. Sichuan: Sichuan Science and Technology Press, 2007 [44] County Annals Editorial Committee of Derung-Nu Autonomous County Gongshan. County Annals of Derung-Nu Autonomous County Gongshan [J]. Beijing: Nationality Publishing House, 2006 [45] Lushui County Annals Editorial Committee. Lushui County Annals [J]. Yunnan: Yunnan People's Publishing House, 1995 [46] Deqin County Annals Editorial Committee. Deqin County Annals [J]. Yunnan: Yunnan Nationality Publishing House, 1997 [47] Yutian County Annals Editorial Committee. Yutian County Annals [J]. Xinjiang: Xinjiang People's Publishing House, 2006 [48] Cele County Annals Editorial Committee. Cele County Annals [J]. Xinjiang: Xinjiang People's Publishing House, 2005 [49] Hetian County Annals Editorial Committee. Hetian County Annals [J]. Xinjiang: Xinjiang People's Publishing House, 2006 [50] Qiemo County Local Chronicles Editorial Committee. Qiemo County Annals [J]. Xinjiang: Xinjiang People's Publishing House, 1996 [51] Shache County Annals Editorial Committee. Shache County Annals [J]. Xinjiang: Xinjiang People's Publishing House, 1996 [52] Yecheng County Annals Editorial Committee. Yecheng County Annals [J]. Xinjiang: Xinjiang People's Publishing House, 1999 [53] Akto County Local Chronicles Editorial Committee. Akto County Annals [J]. Xinjiang: Xinjiang People's Publishing House, 1996 [54] Wuqia County Local Chronicles Editorial Committee. Wuqia County Annals [J]. Xinjiang: Xinjiang People's Publishing House, 1995
National Bureau of Statics of China

(1) This data set is the carbon flux data set of Shenzha alpine wetland from 2016 to 2019, including air temperature, soil temperature, precipitation, ecosystem productivity and other parameters. (2) The data set is based on the field measured data of vorticity, and adopts the internationally recognized standard processing method of vorticity related data. The basic process includes: outlier elimination coordinate rotation WPL correction storage item calculation precipitation synchronization data elimination threshold elimination outlier elimination U * correction missing data interpolation flux decomposition and statistics. This data set also contains the model simulation data calibrated based on the vorticity correlation data set. (3) the data set has been under data quality control, and the data missing rate is 37.3%, and the missing data has been supplemented by interpolation. (4) The data set has scientific value for understanding carbon sink function of alpine wetland, and can also be used for correction and verification of mechanism model.
Da Wei
")
The data set contains the Chinese name, English name and the affiliation between the districts and counties in each administrative division of Qinghai. The data were derived from the Qinghai Society and Economics Statistical Yearbook and the Qinghai Statistical Yearbook. The accuracy of the data is consistent with that of the statistical yearbook. Table 1: The table of administrative divisions in Qinghai has 5 fields. Field 1: Regions Interpretation: Chinese names of the regions Field 2: English names of the regions Interpretation: English names of the regions Field 3: Districts and counties Interpretation: Chinese names of the districts and counties Field 4: English names of the districts and counties Interpretation: English names of the districts and counties Field 5: Land area Unit: square kilometers Table 2: The table of division changes of each county has 5 fields. Field 1: Districts and counties Field 2: Year Field 3: Area Unit: square kilometers Field 4: Number of townships Field 5: Number of Village Committees
Qinghai Provincial Bureau of Statistics
")
The dataset records 1960-2017 years GDP, per capita GDP, GDP growth rate and per capita GDP growth rate of 65 countries along the Belt and Road.Data source:World Bank national accounts data, and OECD National Accounts data files. The dataset contains 9 tables: GDP (constant 2010 US$),GDP (constant LCU),GDP (current LCU),GDP (current US$),GDP per capita (constant LCU),GDP per capita (current LCU),GDP per capita (current US$),GDP growth (annual %),GDP per capita growth (annual %)
XU Xinliang
")
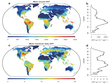
Based on the international trade data from UN comtrade crude oil resources (2709), after sorting, extracting, compiling and spatializing, flow map was made on arcgis 10.2 software platform. From the perspective of central Asia's oil trade relations, priority should be given to ensuring the oil exports of European countries as the main direction of central Asia's oil exports. Before 2006, the exports to Europe accounted for more than 90% of central Asia's exports.From the perspective of export volume and trade relations, since the disintegration of the Soviet union, central Asia has been seeking to diversify its exports and establish broader trade relations, with the number of exporting countries increasing from 3 in 1993 to 18 in 2016.Before 1995, central Asia exported only a small amount of oil, less than 1 million tons. From 1996 to 2013, oil exports increased rapidly and reached a peak.
YANG Yu, HE Ze
")
The trade data between China and BRI Countries, including China's export data to BRI Countries, China's import data from BRI Countries and the total trade volume between China and BRI Countries. BRI Countries refer to the 64 countries along the traditional silk road, including Kazakhstan, Kyrgyzstan, Tajikistan, Uzbekistan, Turkmenistan, Mongolia, Russia, Vietnam, Laos, Kampuchea, Thailand, Malaysia, Singapore, Indonesia, Brunei, Indonesia, Indonesia, convergence, and Bangladesh, Afghanistan, Nepal, Bhutan, Sri Lanka, Maldives, Poland, Czech Republic, Slovakia, Hungary, Slovenia, Croatia, Romania, Bulgaria, Serbia, Montenegro, Macedonia, Bosnia and Herzegovina, Albania, Estonia, Lithuania, Latvia, Ukraine, Belarus, Moldova, Turkey Iran, Syria, Iraq, UAE, Saudi Arabia, Qatar, Bahrain, Kuwait, Lebanon, Oman, Yemen, Jordan, Israel, Palestine, Armenia, Georgia, Azerbaijan, Egypt.
 (2010-2050)")
By applying Supply-demand Balance Analysis, the water resource supply and demand of the whole river basin and each county or district were calculated, based on which the vulnerability of the water resources system of the basin was evaluated. The IPAT equation was used to set a future water resource demand scenario, setting variables such as future population growth rate, economic growth rate, and unit GDP water consumption to establish the scenario. By taking 2005 as the base year and using assorted forecasting data of population size and economic scale, the future water demand scenarios of various counties and cities from 2010 to 2050 were forecast. By applying the basic structure of the HBV conceptual hydrological model of the Swedish Hydrometeorological Institute, a model of the variation tendency of the basin under climate change was designed. The glacial melting scenario was used as the model input to construct the runoff scenario under climate change. According to the national regulations of the water resources allocation of the basin, a water distribution plan was set up to calculate the water supply comprehensively. Considering of the supply and demand situation, the water resource system vulnerability was evaluated by the water shortage rate. By calculating the (grain production) land pressure index of the major counties and cities in the basin, the balance of supply and demand of land resources under the climate change, glacial melt and population growth scenarios was analyzed, and the vulnerability of the agricultural system was evaluated. The Miami formula and HANPP model were used to calculate the human appropriation of net primary biomass and primary biomass in the major counties and cities for the future, and the vulnerability of ecosystems from the perspective of supply and demand balance was assessed.
YANG Linsheng, ZHONG Fanglei

1. The grassland animal husbandry production and management policies in the study area from 1954 to 2012 mainly include: 1) the time series of the formation and evolution of various policies; 2) the key policies related to herdsman's livestock activities and grassland management and utilization. 2. Residents' perception and response to pastoral socio-economic development policies, grassland management systems, ecological compensation policies, ecological restoration projects, and ecological environment status quo.
ZHAO Chengzhang
")
I. Overview This data set contains socio-economic statistics of counties (cities) in the upper reaches of the Yellow River from 2000 to 2005. The data set is divided into basic conditions, comprehensive economics, agriculture, industry and infrastructure, education, health and social security, 4 There are 30 basic categories, including all the socio-economic statistical indicators. Ⅱ. Data processing description The data is stored in excel format, classified by province, with basic socio-economic statistics for each county. Ⅲ. Data content description This data set contains four basic classifications, namely basic situation, comprehensive economy, agriculture, industry and infrastructure, education, health and social security. The basic information includes the administrative area, the number of townships (towns), the number of villagers' committees, the total number of households at the end of the year, the number of rural households, the rural population, the number of employees at the end of the year, the number of rural employees, and the number of agricultural, forestry, animal husbandry and sideline fishermen The total power of agricultural machinery and local telephone users; the total economic categories include: the value added of the primary industry, value added of the secondary industry, revenue within the local fiscal budget, fiscal expenditure, the balance of savings deposits of urban and rural residents, and loans of financial institutions at the end of the year Balance; major categories of agriculture, industry and capital construction include: grain output, cotton output, oil output, total meat output, number of industrial enterprises above designated size, total industrial output value above designated size, and capital investment completed; education, health and social security The major categories include the number of students in ordinary middle schools, the number of students in primary schools, the number of beds in hospitals and health centers, the number of beds in social welfare homes, and the number of beds in social welfare homes. In some remote areas, some data are missing. Ⅳ. Data usage description Through this data set, the socio-economic problems of counties (cities) in the upper reaches of the Yellow River can be analyzed, and the socio-economic driving forces of certain natural processes can be analyzed and researched through this data set.
XUE Xian, DU Heqiang
")
1) Initial data of community characteristics and main plant biological characteristics of the grass-animal equilibrium stage of the test grassland in 1983; 2) Livestock management data of 4-5 grazing grasslands; 3) Observation data of diversity, productivity and functional group of different grazing grassland communities; 4) Observation data on the height, coverage, biomass, and flower morphology, tillering, and leaf characteristics of main plants in different grazing gradient grasslands 5) Observation data of soil nutrients and litter in different grazing grasslands.
ZHAO Chengzhang
")
The data set recorded the sequence data of penned livestock number, full-grown livestock number, and outputs of meat, eggs, milk, wool and woolen products from 1978 to 2016.The data were derived from the Qinghai Society and Economics Statistical Yearbook and the Qinghai Statistical Yearbook. The accuracy of the data is consistent with that of the statistical yearbook. The data set contains three tables: livestock feeding status, main livestock products output, and number of full-grown livestock. Table 1: The table of livestock feeding status contains 7 fields. Field 1: Year Interpretation: Year of the data Field 2: Year-end penned large livestock Interpretation: Number of year-end penned large livestock Unit: 10,000 Field 3: Cattle Interpretation: Number of year-end penned cattle Unit: 10,000 Field 4: Horse Interpretation: Number of year-end penned horses Unit: 10,000 Field 5: Goat Interpretation: Number of year-end penned goats Unit: 10,000 Field 6: Sheep Interpretation: Number of year-end penned sheep Unit: 10,000 Field 7: Pig Interpretation: Number of year-end penned pigs Unit: 10,000 Table 2: The table of full-grown livestock number contains 5 fields. Field 1: Year Interpretation: Year of the data Field 2: Number of full-grown large livestock Unit: 10,000 Field 3: Number of full-grown goats Unit: 10,000 Field 4: Number of full-grown pigs Unit: 10,000 Field 5: Number of full-grown poultry Unit: 10,000 Table 3: The table of main livestock products output contains 14 fields. Field 1: Year Interpretation: Year of the data Field 2: Total output of meat Interpretation: Total output of meat Unit: ton Field 3: Pork Interpretation: Pork output Unit: ton Field 4: Beef Interpretation: Beef output Unit: ton Field 5: Mutton Interpretation: Mutton output Unit: ton Field 6: Other kinds of meat Interpretation: Output of other kinds of meat Unit: ton Field 7: Milk Interpretation: Output of milk Unit: ton Field 8: Cow milk Interpretation: Output of cow milk Unit: ton Field 9: Wool Interpretation: Output of wool Unit: ton Field 10: Sheep wool Interpretation: Output of sheep wool Unit: ton Field 11: Cashmere Interpretation: Output of cashmere Unit: ton Field 12: Cattle hair and villus Interpretation: Output of cattle hair and villus Unit: ton Field 13: Honey Interpretation: Output of honey Unit: ton Field 14: Poultry eggs Interpretation: Output of poultry eggs Unit: ton
Qinghai Provincial Bureau of Statistics
")
The dataset is a 30-minute eddy covariance flux observation data from nine flux stations in the Three Poles, including the data of ecosystem Net Carbon Exchange (NEE), Gross Primary Productivity(GPP), and Ecosystem Respiration (ER) . The time coverage of the data is from 2000 to 2016. The main steps of data pre-processing include outlier removal (±3σ), coordinate axis rotation(three-dimensional wind rotation), Webb-Pearman-Leuning correction, outlier elimination, carbon flux interpolation and decomposition. And missing data is interpolated by the nonlinear empirical formula between CO2 flux value(Fc) and environmental factors.
ZHANG Yangjian, NIU Ben
")
The data set includes the average temperature data of main areas in Qinghai Province such as Xining, Haidong, Menyuan, Huangnan, Hainan, Guoluo, Yushu and Haixi from 1998 to 2016. The data were derived from the Qinghai Society and Economics Statistical Yearbook and the Qinghai Statistical Yearbook. The accuracy of the data is consistent with that of the statistical yearbook. The data table records the monthly and annual average wind speed in eight regions of Qinghai. Unit: Celsius. The data set is mainly applied in geography and socioeconomic research.
Qinghai Provincial Bureau of Statistics
 (v1.0)")
The data includes 30 items of data in four categories: basic information, comprehensive economy, agriculture and industry, education, health and social security in Qinghai Province and Tibet Autonomous Region. It covers the basic data reflecting human activities, such as population, employees, industrial output value, agricultural machinery power, facility agriculture, etc. of the main county administrative units of the Qinghai Tibet Plateau. The data are sorted out according to the statistical yearbook data of China's counties from 2001 to 2018. For the convenience of application, the data of Qinghai and Tibet are independently tabulated and included in the data of each year. The data can be used to analyze human activities and social and economic development in the county, as well as agricultural and rural development and change process.
")
The data set includes: population and GDP data of the arctic (1990-2015) and county-level population and GDP data of the third pole region (gansu, qinghai and Tibet) (1970-2016). Socio-economic statistical attributes include: population (ten thousand), GDP (ten thousand yuan), total industrial and agricultural output (ten thousand yuan), total agricultural output (ten thousand yuan), and total industrial output (ten thousand yuan). The arctic population data are mainly derived from the world populationProspects: 2017 revision by the Department of economic and social affairs, which divides the total population by region and country. The data of the third pole mainly refer to the statistical yearbook of gansu province, qinghai province and Tibet autonomous region.County records of gansu, qinghai and Tibet autonomous regions.
Department of Economic and Social Affairs, National Bureau of Statistics, Qinghai Provincial Bureau of Statistics

It is summarized that the agricultural and socio-economic status of the five Central Asian countries (Kazakhstan, Kyrgyzstan, Tajikistan, Uzbekistan and Turkmenistan) in 2016. This data comes from the statistical yearbook of five Central Asian countries, including six elements: total population, cultivated land area, grain production area, GDP, proportion of agricultural GDP to total GDP, proportion of industrial GDP to total GDP, and forest area. Detailed statistics of the six socio-economic elements of the five Central Asian countries. It can be seen from the statistics that there are different emphases among the six elements of the five Central Asian countries. This data provides basic data for the project, facilitates the subsequent analysis of the ecological and social situation in Central Asia, and provides data support for the project data analysis.
LIU Tie
")
The data set records the statistical bulletin of national economic and social development of Golmud City in Qinghai Province in 2019. The data statistics are from Qinghai Province. According to the data set, there is a word file, which is respectively the statistical bulletin of national economic and social development of Golmud City in 2019. The Gazette covers the annual gross domestic product of the whole city, the completion of the regional public budget revenue, the household registration population and its changes throughout the year, the annual total consumption price index of the whole city, the planting and animal husbandry, the industrial and construction industries, the annual fixed assets investment of the whole City, the total retail sales of social consumer goods, and the total value of the total import and export of the whole city in the whole year. Information statistics and comparative data on the added value of wholesale and retail industry, cultural tourism, health and sports, residents' income, consumption and social security, environment and emergency management, etc.
Qinghai Provincial Bureau of Statistics
")
The socio-economic development data set of Qilian mountain basin includes the socio-economic development indicators of 5 prefecture level cities and 14 districts and counties in 1949-2015, such as industrial structure, population scale, labor force, employment, etc. They are the data subsets of social and economic development of prefecture level cities in Qilian mountain basin and county level cities in Qilian mountain basin. The data comes from Gansu statistical yearbook, Gansu Development Yearbook, Qinghai statistical yearbook, Qinghai national economic and social development statistical bulletin, national agricultural product cost and income data compilation, Xining statistical yearbook. As the data source is the provincial and Municipal Statistical Yearbook published publicly, the data has not been cross verified, and the data consistency test and accuracy verification need to be carried out in the process of data analysis and application. The data set is a macro data set reflecting the social and economic development of Qilian mountain basin, with full coverage and long time series. It can provide basic information for the changes of social and economic development of Qilian mountain basin.
WU Feng
")
This data set is the daily vorticity related flux observation data of Naqu flux station (31.64 ° N 92.01 ° E, 4598 m a.s.l.), including ecosystem net ecosystem productivity (NEP), total primary productivity (GPP) and ecosystem respiration (ER) data. The main steps of data pre-processing include wild point removal (± 3 σ)、 Coordinate axis rotation (3D wind rotation), Webb Pearman Leuning correction, outlier elimination, carbon flux interpolation and decomposition, etc. Missing data are interpolated through the nonlinear empirical formula between CO2 flux value (Fc) and environmental factors.
ZHANG Yangjian
 (2010-2050)")
Taking 2000 as the base year, the future population scenario prediction adopted the Logistic model of population, and it not only can better describe the change pattern of population and biomass but also is widely applied in the economic field. The urbanization rate was predicted using the urbanization Logistic model. Based on the existing urbanization horizontal sequence value, the prediction model was established by acquiring the parameters in the parametric equation applying nonlinear regression. The urban population was calculated by multiplying the predicted population by the urbanization rate. The Logistic model was used to predict the future gross national product of each county (or city), and then, according to the economic development level of each county (or city) in each period (in terms of real GDP per capita), the corresponding industrial structure scenarios in each period were set, and the output value of each industry was predicted. The trend of industrial structure changing in China and the research area lagged behind the growth of GDP, so it was adjusted according to the need of the future industrial structure scenarios of the research area.
ZHONG Fanglei
")
The data include the coastal ports and airport distribution in the Belt and Road region. The data are from the Natural Earth global port and airport data. The data are cut according to the standard map of the 65 countries along the Belt and road, and further corrected, then the distribution of the ports and airports in the area along the B&R is obtained. This data is mainly one to analyze the B&R area's important spatial layout and main characteristics of the transportation facilities, and to get other attributes data of port and airport in the following research, including the throughput of different port cargo types, the incoming and outgoing throughput, the number of docks and berths, the number of passengers on the airport, the data of the flights and routes of ports and airports, we can get further understanding of the spatial differentiation of the distribution of ports and airports in the B&R region.
WANG Chengjin
 (2010-2050)")
By applying supply-demand balance analysis, the water resource supply and demand of the whole river basin and each county or district were calculated, and the results were used to assess the vulnerability of the water resources system in the basin. The IPAT equation was used to establish a future water resource demand scenario, which involved setting various variables, such as the future population growth rate, economic growth rate, and water consumption per unit GDP. By taking 2005 as the base year and using assorted forecasting data of population size and economic scale, the future water demand scenarios of various counties and cities from 2010 to 2050 were predicted. By applying the basic structure of the HBV conceptual hydrological model of the Swedish Hydro-meteorological Institute, a model of the variation trends of the basin under a changing climate was designed. The glacial melting scenario was used as the model input to construct the runoff scenario in response to climate change. According to the national regulations of the water resource allocation in the basin, a water distribution plan was set up to calculate the water supply comprehensively. Considering the supply and demand situation, the water resource system vulnerability was evaluated by the water shortage rate. By calculating the grain production-related land pressure index of the major counties and cities in the basin, the balance of supply and demand of land resources in scenarios of climate change, glacial melting and population growth was analysed, and the vulnerability of the agricultural system was evaluated. The Miami formula and HANPP model were used to calculate the human appropriation of net primary biomass and primary biomass in the major counties and cities in the future, and the vulnerability of ecosystems from the perspective of supply and demand balance was assessed.
YANG Linsheng, ZHONG Fanglei
By applying Supply-demand Balance Analysis, the water resource supply and demand of the whole river basin and each county or district were calculated, on which basis the vulnerability of the water resources system of the basin was evaluated. The IPAT equation was used to set a future water resource demand scenario, setting variables such as future population growth rate, economic growth rate, and unit GDP water consumption to establish the scenario. By taking 2005 as the base year and using assorted forecasting data of population size and economic scale, the future water demand scenarios of various counties and cities from 2010 to 2050 were predicted. By applying the basic structure of the HBV conceptual hydrological model of the Swedish Hydrometeorological Institute, a model of the variation tendency of the basin under climate change was designed. The glacial melting scenario was used as the model input to construct the runoff scenario under climate change. According to the national regulations for the water resources allocation of the basin, a water distribution plan was set up to calculate the water supply comprehensively. Considering the supply and demand situation, the water resource system vulnerability was evaluated by the water shortage rate. By calculating the (grain production) land pressure index of the major counties and cities in the basin, the balance of supply and demand of land resources under the climate change, glacial melt and population growth scenarios was analyzed, and the vulnerability of the agricultural system was evaluated. The Miami formula and HANPP model were used to calculate the human appropriation of net primary biomass and primary biomass in the major counties and cities for the future, and the vulnerability of ecosystems from the perspective of supply and demand balance was assessed.
YANG Linsheng, ZHONG Fanglei

Grassland actual net primary production (NPPa) was calculated by CASA model. CASA model was calculated with the combination of satellite-observed NDVI and climate (e.g. temperature, precipitation and radiation) as the driving factors, and other factors, such as land-use change and human harvest from plant material, were reflected by the changes of NDVI. CASA NPP was determined by two variables, absorbed photosynthetically active radiation’ (APAR) and the light-use efficiency (LUE). Grassland potential net primary production (NPPp) was calculated by TEM model. TEM is one of process-based ecosystem model, which was driven by spatially referenced information on vegetation type, climate, elevation, soils, and water availability to calculate the monthly carbon and nitrogen fluxes and pool sizes of terrestrial ecosystems. TEM can be only applied in mature and undisturbed ecosystem without take the effects of land use into consideration due to it was used to make equilibrium predications. Grassland potential aboveground biomass (AGBp) was estimated by random forest (RF) algorithm, using 345 AGB observation data in fenced grasslands and their corresponding climate data, soil data, and topographical data.
NIU Ben, ZHANG Xianzhou
")
Provide detailed spatial distribution of GDP data in China from 1990 to 2015 year by year. The data is 1km grid data, and the unit is 10000 yuan / square kilometer. This grid data comprehensively considers multiple factors for weight allocation to realize the spatialization of GDP, which is convenient for data sharing and spatial statistical analysis. The data comes from the resource and environment science data registration and publication system. The year-on-year data is obtained by linear interpolation of the original data, and is saved in GeoTIFF file format. The methods and standards of data over the years are consistent, the coverage is complete, and the collection and processing process is traceable and reliable.
WANG Can , WANG Jiachen
")
This data set contains data on the birth rate, mortality rate and natural growth rate in Qinghai. The data were derived from the Qinghai Society and Economics Statistical Yearbook and Qinghai Statistical Yearbook. The accuracy of the data is consistent with that of the statistical yearbooks. The table contains 8 fields. Field 1: Year of the data Field 2: The number of permanent residents, unit: 10,000 Field 3: The number of births Field 4: Birth rate, unit: ‰ Field 5: The number of deaths Field 6: Mortality rate, unit: ‰ Field 7: Natural growth of the population Field 8: Natural growth rate, unit: ‰
Qinghai Provincial Bureau of Statistics
")
Gross domestic product (GDP) is a monetary measure of the market value of all the final goods and services produced in a period of time, which has been used to determine the economic performance of a whole country or region. We have collected the published GDP data. Collect the public GDP data. On the basic of 1-kilometer scale global GDP grid data in 2010 released by the United Nations, the total GDP of the node area was obtained. The lighting data and land use data of node areas are took as auxiliary data, after data preprocessing, data interpolation and multiple regression analysis, establish the relationship between GDP and the hundred meter scale multiple data, and then, the GDP data of 34 key node areas are obtained.
GE Yong, LI Qiangzi, DONG Wen
 (2010-2050)")
Taking 2005 as the base year, the future population scenario was predicted by adopting the Logistic model of population. It not only can better describe the change pattern of population and biomass but is also widely applied in the economic field. The urbanization rate was predicted by using the urbanization Logistic model. Based on the existing urbanization horizontal sequence value, the prediction model was established by acquiring the parameters in the parametric equation by nonlinear regression. The urban population was calculated by multiplying the predicted population by the urbanization rate. The data adopted the non-agricultural population. The Logistic model was used to predict the future gross national product of each county (or city), and then, according to the economic development level of each county (or city) in each period (in terms of GDP per capita),the corresponding industrial structure scenarios in each period were set, and the output value of each industry was predicted. The trend of changes in industrial structure in China and the research area lagged behind the growth of GDP and was therefore adjusted according to the need of the future industrial structure scenarios of the research area.
ZHONG Fanglei
 (2010-2050)")
Taking 2005 as the base year, the future population scenario was predicted by adopting the logistic model of population. This model not only effectively describes the pattern of changes in population and biomass but is also widely applied in the field of economics. The urbanization rate was predicted using the urbanization logistic model. Based on the observed horizontal pattern of urbanization, a predictive model was established by determining the parameters in the parametric equation by applying nonlinear regression. The urban population was calculated by multiplying the predicted population by the urbanization rate. The data represent the non-agricultural population. The logistic model was used to predict the future gross domestic product of each county (or city), and then the economic development level of each county (or city) in each period (in terms of GDP per capita). The corresponding industrial structure scenarios in each period were set, and the output value of each industry was predicted. The trend of industrial structure changes in China and the research area lagged behind the growth in GDP, so the changes were adjusted according to the need for future industrial structure scenarios in the research area.
YANG Linsheng, ZHONG Fanglei
Taking 2005 as the base year, the future population scenario prediction adopted the Logistic model of population, and it not only can better describe the change pattern of population and biomass but is also widely applied in the economic field. The urbanization rate was predicted using the urbanization Logistic model. Based on the existing urbanization horizontal sequence value, the prediction model was established by acquiring the parameters in the parametric equation applying nonlinear regression. The urban population was calculated by multiplying the predicted population by the urbanization rate. The Logistic model was used to predict the future gross national product of each county (or city), and then, according to the economic development level of each county (or city) in each period (in terms of real GDP per capita),the corresponding industrial structure scenarios in each period were set, and each industry’s output value was predicted. The trend of changes in industrial structure in China and the research area lagged behind the growth of GDP, and, therefore, it was adjusted according to the need of the future industrial structure scenarios of the research area.
ZHONG Fanglei, YANG Linsheng
")
The data set includes data of land and natural resources in Qinghai from 1984 to 2012. The data were derived from the Qinghai Society and Economics Statistical Yearbook and the Qinghai Statistical Yearbook. P.S: The land use data have not been updated in the yearbook since 2008. The 2008 data have been cited; therefore. The accuracy of the data is consistent with that of the statistical yearbook. There are two tables, one for natural resources data of every year, and the other is for land use data in different regions. “The land and natural resources in Qinghai” table contains the following information: Year, land, total land area, mountain, basin, river valley, Gobi desert, hilly land; cultivated land area, irrigated land; total grassland area, usable grassland, winter and spring grassland, summer and autumn grassland; forest area, forest coverage ratio, sparse forestland, shrub land, wood stocks; annual total surface runoff, Yellow River Basin, Yangtze River Basin, hydraulic theoretical reserves, installed capacity, annual power generation; coal reserves, iron ore reserves, asbestos reserves, pool salt, magnesium salt, potassium salt, boron, gold ore, lead ore, zinc ore, antimony ore, and limestone for cement. The “Land use in different regions” table includes the following information for each prefecture from 2003 to 2012: Year, region name, total area, cultivated land, garden land, forestland, grassplot, residential land use and industrial and mining land use, land for transportation, land for water conservancy facilities, and unused land.
Qinghai Provincial Bureau of Statistics
")
The data set contains three tables: the crop yield in each county, the per capita production of industrial and agricultural products, and the main crop yield. It recorded the sequence data of major crops, grain, oilseed, fruits, meat and eggs, major industrial products, aluminum, crude oil, steel, cement and power generation in Qinghai from 1978 to 2015. The data were derived from the Qinghai Society and Economics Statistical Yearbook and the Qinghai Statistical Yearbook. The accuracy of the data is consistent with that of the statistical yearbooks. Table 1: The table of statistics of enterprises in each county contains 5 fields. Field 1: Districts and counties Field 2: Year Field 3: The number of industrial enterprises above state designated scale Field 4: Total output value of industrial enterprises above state designated scale Field 5: Urban completed investment in fixed assets Unit: 10 thousand yuan Table 2: The table of overview of the foreign investment use contains 4 fields. Field 1: Year Interpretation: year of the data Field 2: Foreign investment project Interpretation: The number of foreign investment projects Field 3: Foreign investment amount Interpretation: Foreign investment amount Unit: 10,000 dollars Field 4: Actually used amount Interpretation: Actually used foreign investment amount Unit: 10,000 dollars
Qinghai Provincial Bureau of Statistics
")
This data contains part of the economic indicators of Qinghai province and Tibet Autonomous Region. The data statistics based on provinces can be used to construct the evaluation index system for the coupling coordination relationship between urbanization and eco-environment on the Tibetan Plateau. The data of the Tibet Autonomous Region contains seven indicators, including the gross domestic product (GDP), the primary, secondary and tertiary industries, industry, construction industry, and the per capita GDP, the time span is 1951-2016. The time span of the data set of Qinghai province is from 1952 to 2015, besides the above seven indicators, there is one more indicator of Qinghai province called agriculture forwdtry animal husbandry and fishery. All data are derived from the statistical yearbook, which is calculated at current prices. The gross domestic product (GDP) for 2005-2008 has been revised based on data from the second economic census.
DU Yunyan

One belt, one road, 64 countries in 2017 accounted for the total population of the country. Data source: organized by the author. Data quality is good. The data can have one broad prospect in one belt, one road, and the other is comprehensive research on economy, society, population and governance structure. "One belt, one road" covers Asia Pacific, Eurasia, Middle East, Africa, etc., including 65 countries, with a total population of over 4 billion 400 million, accounting for 63% of the world's population. One belt, one road, one belt, one road, one belt, one road, one country, one country, and one country.
SONG Tao
")
1) China's investment on BRI countries from 2003 to 2019. 2) The Data comes from UNCTAD database. 3) The data quality is good. However, the data of Syria, Tajikistan, Nepal, Myanmar, Brunei and Maldives are missing. 4) The data could reveal China's investment on BRI countries since 2003.

This data set is the statistical yearbook of Tibet Autonomous Region in different years, mainly including different social and economic statistical contents. The Tibet Statistical Yearbook is mainly based on statistical charts and analysis. It records the annual economic and social development comprehensively, systematically and continuously through highly intensive statistical data. Obtaining statistical data is a necessary prerequisite for economic and social research. With the help of Tibet statistical yearbook, it can provide data support for the social and Economic Research of Tibet Autonomous Region. Due to the lack of data in the Qinghai Tibet Plateau, it is difficult to find detailed socio-economic statistics on the network platform. This data set comes from the statistical departments of the Tibet Autonomous Region, which can provide support for relevant investigation and research.
FU Bin
")
"One belt, one road" along the lines of risk rating, credit risk rating and Moodie's national sovereignty rating reflects the structure of sovereign risk in every country. The rating of Moodie's national sovereignty is from the highest Aaa to the lowest C level, and there are twenty-one levels. Data source: organized by the author. Data quality is good. The rating level is divided into two parts, including investment level and speculation level. AAA level is the highest, which is the sovereign rating of excellent level. It means the highest credit quality and the lowest credit risk. The interest payment has sufficient guarantee and the principal is safe. The factors that guarantee the repayment of principal and interest are predictable even if they change. The distribution position is stable. C is the lowest rating, indicating that it cannot be used for real investment.
SONG Tao
")
This data set records the statistical bulletin of national economic and social development of Guoluo Tibetan Autonomous Prefecture in Qinghai Province in 2019. The data is collected from the Statistics Bureau of Qinghai Province. The data set contains a word file, which is the statistical bulletin of national economic and social development of goluo Tibetan Autonomous Prefecture in Qinghai Province in 2019. The contents of the communique cover the total economic volume and structure of the whole Prefecture, the development of agriculture and animal husbandry, the development of industry, the investment in fixed assets, the trade and price situation, the financial situation, the development of transportation, posts and telecommunications and tourism, the environmental protection and forestry, the development of education, science and technology, the culture and health of the whole Prefecture The state of the enterprise, the state of the population, people's life and social security development, etc.
Qinghai Provincial Bureau of Statistics
")
The data set contains two tables detailing the total cultivated land area and the cultivated land area in every county at the end of each year. The data are time series data of cultivated land, dry land, paddy field and effective irrigated area in Tibet from 1959 to 2016 and were derived from the Tibet Society and Economics Statistical Yearbook and Tibet Statistical Yearbook. The accuracy of the data is consistent with that of the statistical yearbooks. Table 1: The table of cultivated land area contains 7 fields. Field 1: Year of the data Field 2: Year-end actual cultivated land area, unit: 1000 hectares Field 3: Dry land area, unit: 1000 hectares Field 4: Paddy field area, unit: 1000 hectares Field 5: Reduced area in the current year, unit: 1000 hectares Field 6: Land occupation of national infrastructure, unit: 1000 hectares Field 7: Increased area in the current year, unit: 1000 hectares Table 2: The table of year-end cultivated land area in each county contains 5 fields. Field 1: Year of the data Field 2: The districts and counties included in the data Field 3: Actual cultivated land area, unit: hectare Field 4: Dry land area, unit: hectare Field 5: Effective irrigated area, unit: hectare
National Bureau of Statistics
")
Based on the non survey method, referring to the provincial input-output table and county-level statistical data of the Qilian Mountain region, the project compiled the input-output table of the Qilian Mountain Region in 2017. This table provides a data basis for analyzing the production and consumption of regional economy and the virtual water resources contained in its products or services. The input-output table uses the input-output tables of Qinghai Province, Inner Mongolia Autonomous Region and Gansu Province in 2017, analyzes the industrial production, residents' consumption and interregional trade information of districts and counties included in the Qilian Mountains, and constructs the input-output table of the Qilian Mountains. The input-output table is the characterization of the regional macroeconomic structure and the level of regional products or services.
WU Feng
")
This data set records the statistical data of per capita income and expenditure, Engel coefficient and ranking (2001-2013) of rural residents in all regions of China, and the data are divided by year. The data are collected from the statistical yearbook of Qinghai Province issued by the Bureau of statistics of Qinghai Province. The data set contains 13 data tables with the same structure. For example, the data table in 2013 has four fields: Field 1: Region Field 2: net income Field 3: Engel coefficient Field 4: consumption expenditure
Qinghai Provincial Bureau of Statistics
")
This data set contains time series data on the total planting area, planting area of various grain crops and cash crops, and planting area of vegetables from 1978 to 2016. The data were derived from the Qinghai Society and Economics Statistical Yearbook and Qinghai Statistical Yearbook. The accuracy of the data is consistent with that of the statistical yearbooks. Table 1: The table of total crop planting area contains 9 fields. Field 1: Year of the data Field 2: The total planting area of crops, unit: 1000 hectares Field 3: Planting area of grain crops, unit: 1000 hectares Field 4: Planting area of wheat, unit: 1000 hectares Field 5: Planting area of coarse crops, unit: 1000 hectares Field 6: Planting area of tuber crops, unit: 1000 hectares Field 7: Planting area of cash crops, unit: 1000 hectares Field 8: Planting area of oil crops, unit: 1000 hectares Field 9: Planting area of vegetables, unit: 1000 hectares Table 2: The table of the planting area in each county contains 4 fields. Field 1: Districts and counties Field 2: Year of the data Field 3: Total planting area of crops, unit: hectare Field 4: Planting area of grain crops, unit: hectare
Qinghai Provincial Bureau of Statistics
")
This data set records the statistical bulletin of national economic and social development of Haidong city in Qinghai Province in 2019. The data is collected from the Statistics Bureau of Qinghai Province. The data set contains a word file, which is the statistical bulletin of national economic and social development of Haidong in Qinghai Province in 2019. The Gazette covers the annual gross domestic product of the whole city, the completion of the regional public budget revenue, the household registration population and its changes throughout the year, the annual total consumption price index of the whole city, the planting and animal husbandry, the industrial and construction industries, the annual fixed assets investment of the whole City, the total retail sales of social consumer goods, and the total value of the total import and export of the whole city in the whole year. Information statistics and comparative data on the added value of wholesale and retail industry, cultural tourism, health and sports, residents' income, consumption and social security, environment and emergency management, etc.
Qinghai Provincial Bureau of Statistics

This data includes future population and GDP estimates based on the SSP2 scenario at the Mekong basin grid scale. The data comes from the global population projection data with a spatial resolution of 5 minutes (about 10km) and the GDP projection data with a spatial resolution of 0.5 degrees (about 50km) provided by the ISIMIP. The method of spatial interpolation is used to get 0.25-degree population projection data from 5-min population projection, and 0.5-degree GDP projection data is downscaled to obtain the 0.25 degree GDP data. The data provided by ISIMIP has passed the data with good quality control, and has not been further verified after data interpolation. The data can be used for the socio-economic impact assessment of climate change and extreme climate events in the Mekong River Basin.
LIU Xingcai
")
This dataset is the daily vorticity related flux observation data of Naqu flux station (31.64 ° N 92.01 ° E, 4598 m a.s.l.), including net ecosystem productivity (NEP), total primary productivity (GPP), ecosystem respiration (ER), evapotranspiration, latent heat, sensible heat, air temperature, relative humidity, wind speed, soil temperature, soil moisture and other data. The main steps of data pre-processing include wild point removal (± 3 σ)、 Coordinate axis rotation (3D wind rotation), Webb Pearman Leuning correction, outlier elimination, carbon flux interpolation and decomposition, etc. Missing data are interpolated through the nonlinear empirical formula between CO2 flux value (Fc) and environmental factors.
ZHANG Yangjian
")
This data set records the statistical bulletin of national economic and social development of Hainan Prefecture in Qinghai Province in 2019. The data is collected from the Statistics Bureau of Qinghai Province. The data set contains a word file, which is the statistical bulletin of national economic and social development of Hainan Province in 2019. The communique covers the annual gross domestic product of the whole city, the annual public revenue, the registered residence population and its changes, the total consumption price index of the whole city, the planting and animal husbandry, the industry and the construction industry, the annual fixed assets investment, the total retail sales of the total social consumer goods, and the total value of the total import and export of the whole city in the whole year. Information statistics and comparative data on the added value of wholesale and retail industry, cultural tourism, health and sports, residents' income, consumption and social security, environment and emergency management, etc.
Qinghai Provincial Bureau of Statistics
")
1) data content: social and economic data of major countries and regions in the pan third polar region, including four categories: urbanization index, economic and industrial index, population index and social index, including urbanization rate, total population, population in the largest city, population, GDP, life expectancy and other indicators in the urban agglomeration with population over 1 million; 2) data source and processing method: data source World Bank, 65 countries and regions of Pan third pole are extracted, others are not processed; 3) data quality description: some data are missing from 1960-1992; 4) data application results and prospects: it can be used for urbanization and other socio-economic analysis.
LI Guangdong
(2007-2016)")
The main body of the Tibetan Plateau is Qinghai Province and the Tibetan Autonomous Region. The economic and social data of Qinghai Province and the Tibetan Autonomous Region are the basis for the analysis and assessment of the basic data of sustainable development of populations, resources, environment and economic society on the Tibetan Plateau by integrating the basic data of natural sciences. Under normal circumstances, the statistical yearbooks of all provinces and regions are all in paper and CD-ROM versions, and users need to perform secondary editing before they can use them. This data set mainly relies on the raw data of the Statistical Yearbook of Qinghai Province and the Tibetan Autonomous Region to carry out data conversion and integrate the current economic and social data sets. The temporal coverage of the data is from 2007 to 2016, and the temporal resolution is one year. The spatial coverage is Qinghai Province and the Tibetan Autonomous Region of the Tibetan Plateau. The spatial resolution is the administrative unit of the prefecture or city. The data include information on population, economy, finance, agriculture, forestry, animal husbandry and fishery, investment in fixed assets, education and health.
WANG Shijin
")
Gross domestic product (GDP) is a monetary measure of the market value of all the final goods and services produced in a period of time, which has been used to determine the economic performance of a whole country or region. According to the collected the published global GDP data of 2015, a downscaling model, named support vector machine regression kriging was established for predicting 100-m GDP in thirty-four key nodes along the Belt and Road. The remote sensed night light data, land cover, vegetation and terrain indices were employed as ancillary variables in downscaling process. To solve the problem of missing data existing in the ancillary datasets, we will apply kriging and function interpolation methods to fill gaps. The aggregation and resampling were used to obtain 1-km and 500-m all ancillary variables, as well as 100-m terrain indices including elevation, slope and aspect. The adopted downscaling model contains trend and residual predictions. The support vector machine regression is used to model the relationship among GDP and its ancillary variables for obtaining GDP trends at fine scale based on scale invariant of the relationship. And then, the kriging interpolation is used to estimate GDP residuals at fine scale. In the downscaling process, the mentioned downscaling model was firstly employed in 1-km and 500-m data for obtaining 500-m GDP predictions; and it was again used in 500-m and 100-m data for achieving 100-m GDP predictions. The 100-m GDP predictions in constant 2011 international US dollars would provide high spatial resolution data for risk assessments.
GE Yong, LING Feng
")
This dataset, based on night light data and macro statistical data, uses remote sensing inversion method(1km*1km)to obtain the poverty rate in different regions within each country. It has three advantages. a) The calculation unit can be adjusted according to the boundaries of administrative regions to reflect the poverty rate of sub-regions within the large country and scale, which is rare in statistically data. b) The survey and summary cycle limits the updating of national and sub-regional poverty rate, while the method based on night light data is more convenient. c) Due to the continuous annual data of night light, the difficulty of obtaining regional poverty rate in a long period was overcome. In view of the three outstanding advantages mentioned above, this data set can support to achieve the research subjects and provide scientific data for understanding the basic situation of poverty along the Silk Roads.
ZHANG Qian, Linxiu ZHANG
")
This data set contains time series data on the gross import and export volume, gross import volume, and gross export volume of Qinghai from 1985 to 2016. The data were derived from the Qinghai Society and Economics Statistical Yearbook and Qinghai Statistical Yearbook. The accuracy of the data is consistent with that of the statistical yearbooks. The table contains 4 fields. Field 1: Year Interpretation: Year of the data Field 2: Gross import and export volume, unit: USD 10,000.00 Field 3: Gross import volume, unit: USD 10,000.00 Field 4: Gross export volume, unit: USD 10,000.00
Qinghai Provincial Bureau of Statistics
")
This data set records the statistical bulletin of national economic and social development of Qinghai Haibei Tibetan Autonomous Prefecture in 2019. The data is collected from the Statistics Bureau of Qinghai Province. The data set contains a word file, which is the statistical bulletin of national economic and social development of Qinghai Haibei Tibetan Autonomous Prefecture in 2019. The Gazette covers the whole year's GNP, the whole state's completion of the regional public budget revenue, the household registration population and its changes, the annual total consumption price index of the whole state, the whole state's planting and animal husbandry, the whole state's industrial and construction industry, the whole state's fixed assets investment, the whole state's total retail sales of social consumer goods, the total import and export value of the whole country, and the whole country. Statistics and comparative data on the added value of wholesale and retail industry, cultural tourism, health and sports, residents' income, consumption and social security, environment and emergency management.
Qinghai Provincial Bureau of Statistics
")
The data set records the merchandise exports and imports of 1960-2017 countries along 65 countries along the belt and road. Merchandise imports show the c.i.f. value of goods received from the rest of the world valued in current U.S. dollars.Merchandise exports show the f.o.b. value of goods offered to the rest of the world valued in current U.S. dollars.Data sources:The data on total imports of goods (merchandise) are from the World Trade Organization (WTO), which obtains data from national statistical offices and the IMF's International Financial Statistics, supplemented by the Comtrade database and publications or databases of regional organizations, specialized agencies, economic groups, and private sources (such as Eurostat, the Food and Agriculture Organization, and country reports of the Economist Intelligence Unit). The data set contains 2 tables: Merchandise imports (current US$),Merchandise exports (current US$).
XU Xinliang
")
The data summarizes the agricultural and socio-economic status of the five Central Asian countries ( Kazakhstan, Kyrgyzstan, Tajikistan, Uzbekistan and Turkmenistan ) in 2015.The data comes from the statistical yearbooks of the five Central Asian countries ( Kazakhstan, Kyrgyzstan, Tajikistan, Uzbekistan and Turkmenistan ), including the Total Population, Cultivated Land Area, Grain production area, GDP, The proportion of agricultural GDP to total GDP and The proportion of industrial GDP to total GDP and Forest Area. Detailed statistics of the six socio-economic factors of the five Central Asian countries are given. Statistics show that each of the six elements of the five Central Asian countries has its own focus. The data provides basic data for the project, facilitates analysis of the ecological and social situation in Central Asia, and provides data support for the future data analysis of the project.
LIU Tie
")
This data set records the statistical bulletin of national economic and social development of Yushu prefecture in Qinghai Province in 2019. The data set statistics is from Qinghai Forestry and grass Bureau. The data set contains a word file, which is the statistical bulletin of national economic and social development of Yushu prefecture in 2019. The communique covers the development of agriculture and animal husbandry, investment in fixed assets, domestic trade and tourism, social security, finance and finance, education and postal services, population and people's living conditions, etc. The data of 2019 in this bulletin are all preliminary statistical data; The GDP, the added value of various industries and the per capita GDP are calculated according to the "Regulations on the division of three industries" formulated by the National Bureau of statistics in 2012, the absolute number is calculated according to the current price, and the growth rate is calculated according to the comparable price; the statistical caliber of fixed assets investment is the fixed assets investment project with a planned investment of 5 million yuan or more.
Qinghai Provincial Bureau of Statistics
")
The data set is based on the NPP simulated by 16 dynamic global vegetation models (TRENDY v8) under S2 Scenario (CO2+Climate) and represents the net primary productivity of the ecosystem. Data was derived from Le Quéré et al. (2019). The range of source data is global, and the Qinghai Tibet plateau region is selected in this data set. Original data is interpolated into 0.5*0.5 degree by the nearest neighbor method in space, and the original monthly scale is maintained in time. The data set is the standard model output data, which is often used to evaluate the temporal and spatial patterns of gross primary productivity, and compared with other remote sensing observations, flux observations and other data.
STEPHEN Sitch
")
The data set records the per capita GNI s of 1960-2017 countries along 65 countries along the belt and road. GNI per capita is gross national income divided by midyear population. GNI (formerly GNP) is the sum of value added by all resident producers plus any product taxes (less subsidies) not included in the valuation of output plus net receipts of primary income (compensation of employees and property income) from abroad. Data sources:World Bank national accounts data, and OECD National Accounts data files. The data set contains 5 tables:GNI per capita (constant 2010 US$),GNI per capita (constant LCU),GNI per capita (current LCU),GNI per capita growth (annual %).
XU Xinliang
")
The data set recorded the total investment in fixed assets in Qinghai from 1980 to 2016. The data were derived from the Qinghai Society and Economics Statistical Yearbook and the Qinghai Statistical Yearbook. The accuracy of the data is consistent with that of the statistical yearbook. The table contains 11 fields. Field 1: Year Interpretation: Year of the data Field 2: Total Interpretation: Total investment in fixed assets Unit: 100,000,000 yuan Field 3: State-owned economy Interpretation: State-owned economic investment in fixed assets Unit: 100,000,000 yuan Field 4: Collective Economy Interpretation: Collective economic investment in fixed assets Unit: 100,000,000 yuan Field 5: Individual Economy Interpretation: Individual economic investment in fixed assets Unit: 100,000,000 yuan Field 6: Other types of economy Interpretation: Other economic investment in fixed assets Unit: 100,000,000 yuan Field 7: Total Growth Interpretation: Total growth of investment in fixed assets Unit: % Field 8: State-owned growth Interpretation: Growth of state-owned economic investment in fixed assets Unit: % Field 9: Collective growth Interpretation: Growth of collective economic investment in fixed assets Unit: % Field 10: Individual Growth Interpretation: Growth of individual economic investment in fixed assets Unit: % Field 11: Other growth Interpretation: Growth of other economic investment in fixed assets Unit: %
Qinghai Provincial Bureau of Statistics, Qinghai Provincial Bureau of Statistics
")
The distribution data of Central Asia desert oil and gas fields are in the form of vector data in ". SHP". Including the distribution of oil and gas fields and major urban settlements in the five Central Asian countries. The data is extracted and cut from modis-mcd12q product. The spatial resolution of the product is 500 m, and the time resolution is 1 year. IGBP global vegetation classification scheme is adopted as the classification standard. The scheme is divided into 17 land cover types, among which the urban data uses the construction and urban land in the scheme. The data can provide data support for the assessment and prevention of sandstorm disasters in Central Asia desert oil and gas fields and green town.
GAO Xin
")
This data set records the statistical data of per capita GDP and growth rate and ranking (2010-2018) of all regions in China, and the data are divided by year. The data are collected from the statistical yearbook of Qinghai Province issued by the Bureau of statistics of Qinghai Province. The data set contains eight data tables, each of which has the same structure. For example, the data table of 2017-2018 has four fields: Field 1: Region Field 2: quantity Field 3: Rank Field 4: growth rate
Qinghai Provincial Bureau of Statistics
")
The data set records the per capita electricity consumption of 1971-2014 countries along 65 countries along the belt and road. Data sources: IEA,http://www.iea.org/stats/index.asp.Data on electric power production and consumption are collected from national energy agencies by the International Energy Agency (IEA) and adjusted by the IEA to meet international definitions. Data are reported as net consumption as opposed to gross consumption. Net consumption excludes the energy consumed by the generating units. For all countries except the United States, total electric power consumption is equal total net electricity generation plus electricity imports minus electricity exports minus electricity distribution losses.
XU Xinliang
")
This database is based on the theory of emergy analysis for 17 typical countries along the “Belt and Road” during 2008-2014. These countries are include Kazakhstan, Kyrgyzstan, Tajikistan, Uzbekistan, Turkmenistan, Mongolia, Russia, Pakistan, Bangladesh, Afghanistan, Nepal, Thailand, Myanmar, Ukraine, Moldova, Belarus and Azerbaijan. The basic data sources of this database mainly include detailed information, goods and services on environmental resource flows, natural capital stocks and human production activities. The data in database is calculated and evaluated based on the solar emergy. The database consists of three tables, which are the emergy analysis table of main resource flow, comprehensive emergy analysis table of the main resource category and the system emergy indicators analysis table. The emergy transformities used in this database is updated and calculated according to the emergy baseline (12.0E+24seJ/y) given by Pro. Brown in 2016. Based on the basic data in the database, it can effectively calculate the emergy-based sustainability index system, and give the reasons for the analysis results, the solution and future planning direction for the study country. It is of great significance to the development of the national ecological economic system and provide a scientific basis for the government to improve the sustainable development status of the national ecological economic system.
Li Haitao
")
This data set records the statistical bulletin of national economic and social development of Huangnan Prefecture in Qinghai Province in 2019. The data is collected from the Statistics Bureau of Qinghai Province. The data set contains a word file, which is the statistical bulletin of national economic and social development of Huangnan Prefecture of Qinghai Province in 2019. The Gazette covers GNP, GNP public revenue, total population and its changes in the whole state, the total consumer price index in the whole state, the planting and animal husbandry in the whole state, the development of industrial and construction industries in the whole state, the completion of fixed assets investment in the whole state, and the total retail sales of social consumer goods in the whole state. Information statistics and comparative data are provided in the following aspects: economic situation, total value of goods import and export, added value of wholesale and retail industry, cultural tourism, health and sports, residents' income, consumption and social security, environment and emergency management.
Qinghai Provincial Bureau of Statistics
")
This data set contains the time series data on the total retail sales of consumer goods, total amount of wholesale retail trade, and the total retail sales in the accommodation, catering and other industries. The data were derived from the Qinghai Society and Economics Statistical Yearbook and Qinghai Statistical Yearbook. The accuracy of the data is consistent with that of the statistical yearbooks. The table contains 5 fields. Field 1: Year of the data Field 2: Total retail sales of consumer goods, unit: 10,000 yuan Field 3: The total amount of wholesale retail trade, unit: 10,000 yuan Field 4: The total retail sales in the accommodation and catering industries, unit: 10,000 yuan Field 5: The total retail sales of other industries, unit: 10,000 yuan
Qinghai Provincial Bureau of Statistics
")
The data set describes the per capita main economic indicators in Tibet from 1965 to 2016, including time series data on the regional GDP, gross agricultural output value, gross industrial output value, grain production, total retail sales of consumer goods, savings account balances, per capita net income of farmers and herdsmen, and per capita net income of employees in the district. The data were derived from the Tibet Society and Economics Statistical Yearbook and Tibet Statistical Yearbook. The accuracy of the data is consistent with that of the statistical yearbooks. Table 1: The table of the main per capita economic indicators contains 9 fields. Field 1: Year of the data Field 2: Regional GDP, unit: yuan Field 3: Gross agricultural output value, unit: yuan Field 4: Gross industrial output, unit: yuan Field 5: Grain production, unit: kilograms Field 6: Total retail sales of consumer goods, unit: yuan Field 7: Savings account balance, unit: yuan Field 8: Per capita net income of farmers and herdsmen, unit: yuan Field 9: Per capita net income of employees in the district, unit: yuan Table 2: The table of per capita indicators in each county contains 6 fields. Field 1: Districts and counties Field 2: Year of the data Field 3: Per capita grain possession, unit: kilograms Field 4: Per capita GDP, unit: yuan Field 5: Per capita local fiscal revenue, unit: yuan Field 6: Savings account balance of urban and rural residents, unit: 10,000 yuan
National Bureau of Statistics
")
The data set contains time series data on the output values of the agricultural, forestry, animal husbandry, fishery and industrial sectors in Tibet from 1959 to 2016 and features tables that contain the output values of the agricultural, forestry, animal husbandry and fishery sectors in each county, the output values of the agricultural, forestry, animal husbandry, fishery and industrial sectors in each county, and the total output values of the agricultural, forestry, animal husbandry and fishery sectors. The data were derived from the Tibet Society and Economics Statistical Yearbook and Tibet Statistical Yearbook. The accuracy of the data is consistent with that of the statistical yearbooks. Table 1: The table of the output values of the agricultural, forestry, animal husbandry and fishery sectors in each county contains 3 fields. Field 1: Year of the data Field 2: Districts and counties included in the data Field 3: The output values of the agricultural, forestry, animal husbandry and fishery sectors in each year, unit: 10,000 yuan. Table 2: The table of the output values of the agricultural, forestry, animal husbandry, fishery and industry sectors in each county contains 9 fields. Field 1: Year of the data Field 2: Districts and counties included in the data Field 3: Total output value of agriculture, forestry, animal husbandry and fishery, unit: 10,000 yuan Field 4: Agriculture, unit: 10,000 yuan Field 5: Forestry, unit: 10,000 yuan Field 6: Animal husbandry, unit: 10,000 yuan Field 7: Fishery, unit: 10,000 yuan Field 8: Service Industry, unit: 10,000 yuan Field 9: Other industry, unit: 10,000 yuan Table 3: The table of the total output values of the agricultural, forestry, animal husbandry and fishery sectors contains 7 fields. Field 1: Year of the data Field 2: Total output value, unit: 10,000 yuan Field 3: Agriculture, unit: 10,000 yuan Field 4: Forestry, unit: 10,000 yuan Field 5: Animal husbandry, unit: 10,000 yuan Field 6: Fishery, unit: 10,000 yuan Field 7: Agriculture, forestry, animal husbandry, fishery and service industry, unit: 10,000 yuan
National Bureau of Statistics
")
The data set contains time series data of various industrial products in the Tibetan Autonomous Region from 1956 to 2016, such as chrome ore, power generation, hydroelectric power, cement, etc. The data were derived from the Tibet Society and Economics Statistical Yearbook and Tibet Statistical Yearbook. The accuracy of the data is consistent with that of the statistical yearbook. The table contains 13 fields. Field 1: Year of the data Field 2: Chromium ore production, unit: ton Field 3: Power generation, unit: 10,000 kilowatt per hour Field 4: Hydroelectric power, unit: 10,000 kilowatt per hour Field 5: Cement, unit: ton Field 6: Beer production, unit: ton Field 7: Mineral water, unit: ton Field 8: Chinese traditional patent medicines, unit: ton Field 9: Flour, unit: ton Field 10: Edible vegetable oil, unit: ton Field 11: Woollen yarn, unit: ton Field 12: Carpet, unit: square metre Field 13: Clothing, unit: pair/piece
National Bureau of Statistics
")
The data set records the statistical data of added value, growth rate and ranking (2001-2018) of the secondary and tertiary industries in various regions of China, and the data are divided by year. The data are collected from the statistical yearbook of Qinghai Province issued by the Bureau of statistics of Qinghai Province. The data set contains 18 data tables with the same structure. For example, the data table in 2018 has three fields: Field 1: Region Field 2: added value of secondary industry Field 3: added value of tertiary industry
Qinghai Provincial Bureau of Statistics
 dataset of Tibetan Plateau (1980-2018)")
The data set is based on the GPP simulated by 16 dynamic global vegetation models (TRENDY v8) under S2 Scenario (CO2+Climate) and represents the gross primary productivity of the ecosystem. Data was derived from Le Qu é r é Et al. (2019). The range of source data is global, and the Qinghai Tibet plateau region is selected in this data set. Original data is interpolated into 0.5*0.5 degree by the nearest neighbor method in space, and the original monthly scale is maintained in time. The data set is the standard model output data, which is often used to evaluate the temporal and spatial patterns of gross primary productivity, and compared with other remote sensing observations, flux observations and other data.
STEPHEN Sitch
")
The data set records the mileage of railways, highways and civil aviation in Qinghai from 1952 to 2015. The data were derived from the Qinghai Society and Economics Statistical Yearbook and the Qinghai Statistical Yearbook. The accuracy of the data is consistent with that of the statistical yearbook The table contains 12 fields. Field 1: Year Interpretation: Year of the data Field 2: Mileage of railway in use Unit: kilometers Field 3: Railway routes density Unit: kilometers / 10,000 square kilometers Field 4: Highway traffic mileage Unit: kilometers Field 5: Highway routes density Unit: kilometers Field 6: Mileage of Highway with pavements Unit: kilometers Field 7: High graded highway, Sub-high graded highway Unit: kilometers Field 8: Total highway grades Unit: kilometers Field 9: Highway High Speed Unit: kilometers Field 10: Grade one and two highway Unit: kilometers Field 11: Roads without grades Unit: kilometers Field 12: Civil Aviation Mileage Unit: kilometers
Qinghai Provincial Bureau of Statistics
")
The data set contains two tables: the table of crop planting area and the table of crop planting area in counties over time. These tables present the statistics of the planting area of various crops and the planting areas in counties in Tibet from 1951 to 2016. The data were derived from the Tibet Society and Economics Statistical Yearbook and Tibet Statistical Yearbook. The accuracy of the data is consistent with that of the statistical yearbooks. Table 1: The table of crop planting area contains 14 fields. Field 1: Year of the data Field 2: The total crop planting area, unit: 1000 hectares Field 3: Grain crop planting area, unit: 1000 hectares Field 4: Hulless barley planting area, unit: 1000 hectares Field 5: Wheat planting area, unit: 1000 hectares Field 6: Winter wheat planting area, unit: 1000 hectares Field 7: Legume planting area, unit: 1000 hectares Field 8: Root and tuber crop planting area, unit: 1000 hectares Field 9: Oil crop planting area, unit: 1000 hectares Field 10: Rapeseed planting area, unit: 1000 hectares Field 11: Peanut planting area, unit: 1000 hectares Field 12: Other crop planting area, unit: 1000 hectares Field 13: Vegetable planting area, unit: 1000 hectares Field 14: Silage crop planting area, unit: 1000 hectares Table 2: The table of crop planting area in each county over time contains 7 fields. Field 1: Year of the data Field 2: Districts and counties included in the data Field 3: Crop planting area, unit: 1000 hectares Field 4: Grain crop planting area, unit: 1000 hectares Field 5: Grain planting area, unit: 1000 hectares Field 6: Legume planting area, unit: 1000 hectares Field 7: Oil crop planting area, unit: 1000 hectares
National Bureau of Statistics
")
Gross domestic product (GDP) is a monetary measure of the market value of all the final goods and services produced in a period of time, which has been used to determine the economic performance of a whole country or region. We have collected the published GDP data, then obtained the 1-km gridded datasets for GDP of 2015 in five key nodes over Bengal and Myanmar, including Dacca, Chittagong, Kyaukpyu, Rangoon and Mandalay. To solve the problem of missing data existing in the current datasets, we will apply kriging and function interpolation methods to fill gaps. We will also develop the multi-source data fusion method based on geostatistics to achieve the GDP predictions of time continuously and high spatial resolution.
GE Yong, LING Feng
")
The data includes the total income and various income of 1280 households at domestic and abroad, which is used to support the analysis of livelihood output in sustainable livelihoods. The field survey data collected by the research group. Before collecting the data, the research group and the invited experts conducted a pretest to improve the questionnaire; before the formal survey, the personnel participating in the data collection were strictly trained; during the formal survey, each questionnaire could be filed after three times of inspection. The data is of great value for understanding the livelihood results of farmers in the vulnerable areas of environment and economy, and is an important supplement to the national and macro data in this area.
Linxiu ZHANG, BAI Yunli
")
The data set records the health expenditure of 2000-2015 countries along 65 countries along the belt and road. Current expenditures on health per capita in current US dollars. Estimates of current health expenditures include healthcare goods and services consumed during each year.Data sources: World Health Organization Global Health Expenditure database (http://apps.who.int/nha/database). The data set contains 2 tables:Current health expenditure (% of GDP),Current health expenditure (% of GDP)
XU Xinliang
")
This data set records the statistical data of per capita income and expenditure, Engel coefficient and ranking (2004, 2007) of urban residents in all regions of China, and the data are divided by year. The data are collected from the statistical yearbook of Qinghai Province issued by the Bureau of statistics of Qinghai Province. The data set consists of two tables: per capita income and expenditure of urban residents in different regions of China, Engel coefficient and ranking (2004) 2004.xls Per capita income and expenditure, Engel coefficient and ranking of urban residents in different regions of China (2007) 2007.xls, the data table structure is the same. For example, the data table in 2007 has four fields: Field 1: Province (city, district) Field 2: disposable income Field 3: consumption expenditure Field 4: Engel coefficient
Qinghai Provincial Bureau of Statistics
")
The data set mainly recorded the series data of GDP, gross industrial output, and gross agricultural output in major cities and counties of the Tibetan Plateau from 1970 to 2006. It is used to study social and economic changes on the Tibetan Plateau. The table has ten fields. Field 1: Year Interpretation: Year of the data Field 2: Province Interpretation: The province from which the data were obtained Field 3: City/Prefecture Interpretation: The city or prefecture from which the data were obtained Field 4: County Interpretation: The name of the county Field 5: GDP (10,000 yuan) Interpretation: Gross domestic product Field 6: Gross Industrial and Agricultural Output (10,000 Yuan) Interpretation: Gross Industrial and Agricultural Output Field 7: Gross Agricultural Output (10,000 Yuan) Interpretation: Gross Agricultural Output Field 8: Gross Industrial Output (10,000 Yuan) Interpretation: Gross Industrial Output Field 9: Data Sources Interpretation: Source of Data Extraction Field 10: Remarks Interpretation: Calculation method of gross out value and description of constant prices The data comes from the statistical yearbook and county annals. Some are listed as follows. [1] Gansu Yearbook Editorial Committee. Gansu Yearbook [J]. Beijing: China Statistics Press, 1984, 1988-2009 [2] Statistical Bureau of Yunnan Province. Yunnan Statistical Yearbook [J]. Beijing: China Statistics Press, 1988-2009 [3] Statistical Bureau of Sichuan Province, Sichuan Survey Team. Sichuan Statistical Yearbook [J]. Beijing: China Statistics Press, 1987-1991, 1996-2009 [4] Statistical Bureau of Xinjiang Uighur Autonomous Region . Xinjiang Statistical Yearbook [J]. Beijing: China Statistics Press, 1989-1996, 1998-2009 [5] Statistical Bureau of Tibetan Autonomous Region. Tibet Statistical Yearbook [J]. Beijing: China Statistics Press, 1986-2009 [6] Statistical Bureau of Qinghai Province. Qinghai Statistical Yearbook [J]. Beijing: China Statistics Press, 1986-1994, 1996-2008. [7] County Annals Editorial Committee of Huzhu Tu Autonomous County. County Annals of Huzhu Tu Autonomous County [J]. Qinghai: Qinghai People's Publishing House, 1993 [8] Haiyan County Annals Editorial Committee. Haiyan County Annals[J]. Gansu: Gansu Cultural Publishing House, 1994 [9] Menyuan County Annals Editorial Committee. Menyuan County Annals[J]. Gansu: Gansu People's Publishing House, 1993 [10] Guinan County Annals Editorial Committee. Guinan County Annals [J]. Shanxi: Shanxi People's Publishing House, 1996 [11] Guide County Annals Editorial Committee. Guide County Annals[J]. Shanxi: Shanxi People's Publishing House, 1995 [12] Jianzha County Annals Editorial Committee. Jianzha County Annals [J]. Gansu: Gansu People's Publishing House, 2003 [13] Dari County Annals Editorial Committee. Dari County Annals [J]. Shanxi: Shanxi People's Publishing House, 1993 [14] Golmud City Annals Editorial Committee. Golmud City Annals [J]. Beijing: Fangzhi Publishing House, 2005 [15] Delingha City Annals Editorial Committee. Delingha City Annals [J]. Beijing: Fangzhi Publishing House, 2004 [16] Tianjun County Annals Editorial Committee. Tianjun County Annals [J]. Gansu: Gansu Cultural Publishing House, 1995 [17] Naidong County Annals Editorial Committee. Naidong County Annals [J]. Beijing: China Tibetology Press, 2006 [18] Gulang County Annals Editorial Committee. Gulang County Annals [J]. Gansu: Gansu People's Publishing House, 1996 [19] County Annals Editorial Committee of Akesai Kazak Autonomous County. County Annals of Akesai Kazakh Autonomous County [J]. Gansu: Gansu People's Publishing House, 1993 [20] Minxian County Annals Editorial Committee. Minxian County Annals [J]. Gansu: Gansu People's Publishing House, 1995 [21] Dangchang County Annals Editorial Committee. Dangchang County Annals [J]. Gansu: Gansu Cultural Publishing House, 1995 [22] Dangchang County Annals Editorial Committee. Dangchang County Annals(Sequel) (1985-2005) [J]. Gansu: Gansu Cultural Publishing House, 2006 [23] Wenxian County Annals Editorial Committee. Wenxian County Annals[J]. Gansu: Gansu Cultural Publishing House, 1997 [24] Kangle County Annals Editorial Committee. Kangle County Annals [J]. Shanghai: Sanlian Bookstore. 1995 [25] County Annals Editorial Committee of Jishishan (Baoan, Dongxiang, Sala) Autonomous County. County Annals of Jishishan (Baoan, Dongxiang, Sala) Autonomous County[J], Gansu: Gansu Cultural Publishing House, 1998 [26] Luqu County Annals Editorial Committee. Luqu County Annals [J]. Gansu: Gansu People's Publishing House, 2006 [27] Zhouqu County Annals Editorial Committee. Zhouqu County Annals [J]. Shanghai: Sanlian Bookstore. 1996 [28] Xiahe County Annals Editorial Committee. Xiahe County Annals [J]. Gansu: Gansu Cultural Publishing House, 1999 [29] Zhuoni County Annals Editorial Committee. Zhuoni County Annals [J]. Gansu: Gansu Nationality Publishing House, 1994 [30] Diebu County Annals Editorial Committee. Diebu County Annals [J]. Gansu: Lanzhou University Press, 1998 [31] Pengxian County Annals Editorial Committee. Pengxian County Annals [J]. Sichuan: Sichuan People's Publishing House, 1989 [32] Guanxian County Annals Editorial Committee. Guanxian County Annals [J]. Sichuan: Sichuan People's Publishing House, 1991 [33] Wenjiang County Annals Editorial Committee. Wenjiang County Annals [J]. Sichuan: Sichuan People's Publishing House, 1990 [34] Shifang County Annals Editorial Committee. Shifang County Annals [J]. Sichuan: Sichuan University Press, 1988 [35] Tianquan County Annals Editorial Committee. Tianquan County Annals [J]. Sichuan: Sichuan Science and Technology Press, 1997 [36] Shimian County Annals Editorial Committee. Shimian County Annals [J]. Sichuan: Sichuan Cishu Publishing House, 1999 [37] Lushan County Annals Editorial Committee. Lushan County Annals [J]. Sichuan: Fangzhi Publishing House, 2000 [38] Hongyuan County Annals Editorial Committee. Hongyuan County Annals [J]. Sichuan: Sichuan People's Publishing House, 1996 [39] Wenchuan County Annals Editorial Committee. Wenchuan County Annals [J]. Sichuan: Bayu Shushe, 2007 [40] Derong County Annals Editorial Committee. Derong County Annals [J]. Sichuan: Sichuan University, 2000 [41] Baiyu County Annals Editorial Committee. Baiyu County Annals [J]. Sichuan: Sichuan University Press, 1996 [42] Batang County Annals Editorial Committee. Batang County Annals [J]. Sichuan: Sichuan Nationality Publishing House, 1993 [43] Jiulong County Annals Editorial Committee. Jiulong County Annals(Sequel) (1986-2000) [J]. Sichuan: Sichuan Science and Technology Press, 2007 [44] County Annals Editorial Committee of Derung-Nu Autonomous County Gongshan. County Annals of Derung-Nu Autonomous County Gongshan [J]. Beijing: Nationality Publishing House, 2006 [45] Lushui County Annals Editorial Committee. Lushui County Annals [J]. Yunnan: Yunnan People's Publishing House, 1995 [46] Deqin County Annals Editorial Committee. Deqin County Annals [J]. Yunnan: Yunnan Nationality Publishing House, 1997 [47] Yutian County Annals Editorial Committee. Yutian County Annals [J]. Xinjiang: Xinjiang People's Publishing House, 2006 [48] Cele County Annals Editorial Committee. Cele County Annals [J]. Xinjiang: Xinjiang People's Publishing House, 2005 [49] Hetian County Annals Editorial Committee. Hetian County Annals [J]. Xinjiang: Xinjiang People's Publishing House, 2006 [50] Qiemo County Local Chronicles Editorial Committee. Qiemo County Annals [J]. Xinjiang: Xinjiang People's Publishing House, 1996 [51] Shache County Annals Editorial Committee. Shache County Annals [J]. Xinjiang: Xinjiang People's Publishing House, 1996 [52] Yecheng County Annals Editorial Committee. Yecheng County Annals [J]. Xinjiang: Xinjiang People's Publishing House, 1999 [53] Akto County Local Chronicles Editorial Committee. Akto County Annals [J]. Xinjiang: Xinjiang People's Publishing House, 1996 [54] Wuqia County Local Chronicles Editorial Committee. Wuqia County Annals [J]. Xinjiang: Xinjiang People's Publishing House, 1995
National Bureau of Statistics
")
The data set records the sequence data of main crops, grain, oil, fruit, meat and eggs, and main industrial products, such as aluminium, crude oil, steel, cement and power generation in Qinghai Province from 1978 to 2016. Data are collected from the statistical yearbook: Qinghai Social and Economic Statistics Yearbook and Qinghai Statistical Yearbook, with the same accuracy as the statistical yearbook extracted from the data. The data set contains three tables: crop yield per county, per capita output of major agricultural products, and output of major agricultural products. Data Table 1: There are 17 fields in the data table of per capita output of major agricultural products Field 1: Year Interpretation: Year of Data Field 2: Food Interpretation: Per capita output of grain products is kilograms Field 3: Oil Interpretation: Per capita output of oil products is kg Field 4: Fruit Interpretation: Per capita output of fruit products is kg Field 5: Milk Interpretation: Milk product per capita output kg Field 6: Meat Interpretation: Meat product per capita output kg Field 7: Interpretation of beef and mutton: The per capita output of beef and mutton products is kg. Field 8: Wool Interpretation: Per capita output of wool products in kilograms Field 9: Aquatic product Interpretation: Aquatic product per capita output kg Field 10: Interpretation of raw salt: Per capita output of raw salt products is kilograms Field 11: Machine paper and cardboard explanation: Machine paper and cardboard products per capital output kilogram Field 12: Raw coal Interpretation: per capita output of raw coal products kilograms Field 13: Aluminum Interpretation: Per capita output of aluminium products in kilograms Field 14: Crude Oil Interpretation: Per capita output of crude oil products in kilograms Field 15: Generation Interpretation: Per capita Generation in kilowatt hours Field 16: Steel Interpretation: Per capita steel output per kilogram Field 17: Cement Interpretation: Per capita output of cement products is kg Data Table 2: Major Agricultural Products Output Data Table has 13 fields Field 1: Year Interpretation: Year of Data Field 2: 10,000 tons of grain Field 3: Ten thousand tons of Wheat Field 4: 10,000 tons of miscellaneous grain Field 5: Ten thousand tons of potatoes Field 6: 10,000 tons of oil Field 7: Ten thousand tons of rapeseed Field 8: 10,000 tons of vegetables Field 9: Fruit tonnes Field 10: Apple tons Field 11: Pear tonnes Field 12: Grape tonnes Field 13: Aquatic product output ton Data Table 3: There are 6 fields in the crop yield data table of each county. Field 1: District Field 2: Year Field 3: Total grain output ton Field 4: Cotton output ton Field 5: Oil output ton Field 6: Total Meat Production Tons
Qinghai Provincial Bureau of Statistics
")
This data set contains information on the energy production and consumption in Qinghai Province from 1990 to 2016. The data were derived from the Qinghai Society and Economics Statistical Yearbook and Qinghai Statistical Yearbook. The accuracy of the data is consistent with that of the statistical yearbooks. Table 1: The table of total energy production and its composition contains 6 fields. Field 1: Year Field 2: Total energy production, unit: 10,000 tons of standard coal Field 3: Proportion of raw coal, unit: % Field 4: Proportion of natural gas, unit: % Field 5: Proportion of hydropower, unit: % Field 6: Proportion of crude oil, unit: % Table 2: The table of total energy consumption and its composition contains 6 fields. Field 1: Year Field 2: Total energy consumption, unit: 10,000 tons of standard coal Field 3: Proportion of raw coal, unit: % Field 4: Proportion of crude oil, unit: % Field 5: Proportion of natural gas, unit: % Field 6: Proportion of hydropower, unit: %
Qinghai Provincial Bureau of Statistics
")
This data set contains four tables: number of students per 10,000 people in Qinghai, basic situation of primary schools and general middle schools, and students statistics for each county. Time series data are recorded for students enrolled in various types of schools, number of teachers, number of school students, number of graduates, etc. The data were derived from the Qinghai Society and Economics Statistical Yearbook and Qinghai Statistical Yearbook. The accuracy of the data is consistent with that of the statistical yearbooks. Table 1: The table of the number of school students per 10,000 people in Qinghai contains 6 fields. Field 1: Year of the data Field 2: Number of students in colleges and universities per 10,000 people Field 3: Number of students in secondary schools per 10,000 people Field 4: Number of students in specialized secondary schools per 10,000 people Field 5: Number of middle school students per 10,000 people Field 6: Number of primary school students per 10,000 people Table 2: The table of the basic situation of primary schools contains 7 fields. Field 1: Year of the data Field 2: The number of students graduating from primary schools, unit: 10,000 Field 3: The number of students enrolled in primary schools, unit: 10.000 Field 4: The number of students in primary schools, unit: 10.000 Field 5: The number of employees in primary schools, unit: 10.000 Field 6: The number of teachers in primary schools Field 7: The student-teacher ratio in primary schools Table 3: The table of the basic situation of general middle schools contains 7 fields. Field 1: Year of the data Field 2: The number of students graduating from general middle schools Field 3: The number of students enrolled in general middle schools Field 4: The number of students in general middle schools Field 5: The number of employees in general middle schools Field 6: The number of teachers in general middle schools Field 7: The student-teacher ratio in general middle schools Table 4: The table of student statistics for each county contains 7 fields. Field 1: Districts and counties Field 2: Year of the data Field 3: Number of students per 10,000 people Field 4: Number of students supervised by each teacher Field 5: Total number of school students Field 6: Number of school students in general middle schools Field 7: Number of school students in primary schools
Qinghai Provincial Bureau of Statistics
Contact Support
Links
National Tibetan Plateau Data CenterFollow Us

A Big Earth Data Platform for Three Poles © 2018-2020 No.05000491 | All Rights Reserved
|  No.11010502040845
Tech Support: westdc.cn